Let’s be honest – Ordnance Survey maps are brilliant.
They are the backbone of British navigation. Whether you are planning a ramble through the Peak District or trying to find that obscure country pub your mate recommended, OS maps have been our trusted companion for over 230 years.
They are a national treasure. A cultural icon, even.
But here is the thing:
When you are designing a multi-million-pound development, resolving a boundary dispute with your neighbour, or calculating precise ground levels for drainage systems, that warm fuzzy trust in OS maps might lead you astray.
How accurate are OS maps, really?
More importantly, when do their limitations become a genuine risk to your project’s success – and your bottom line?
That is exactly what we are going to unpack today. We will explore the official accuracy of OS maps, explain why these inaccuracies exist, and show you precisely when you need to move beyond a standard map to a professional topographical survey.
Because whilst OS maps are fantastic for many purposes, there is a reason architects, engineers, and developers commission bespoke surveys.
Let’s dive in.
Understanding Ordnance Survey Map Accuracy: The Official Position
What Exactly is OS MasterMap?
First, let’s clarify what we are talking about.
For professional purposes, the key product isn’t that folded paper map in your rucksack. It is the OS MasterMap Topography Layer – the most detailed, large-scale digital mapping data of Great Britain, containing over 500 million uniquely identified features.
This is what councils, utility companies, and planning departments use as their base mapping.
But here is where it gets interesting.
The Two Types of Accuracy You Need to Know
The Ordnance Survey themselves are quite transparent about their accuracy levels. According to the OS MasterMap Topography Layer technical specification, they measure accuracy in two ways:
Absolute Accuracy
This measures how closely a point’s coordinates in the dataset agree with the true coordinates on the ground, referenced to the British National Grid. Accuracy is expressed as RMSE (root mean squared error) – the distance from the true position within which roughly 67% of well-defined points would be expected to fall.
The official figures published by HM Land Registry are:
| Scale | RMSE | 95% Confidence |
| 1:1250 (urban) | ±0.5m | ±0.8m |
| 1:2500 (rural, resurveyed) | ±1.1m | ±1.9m |
| 1:2500 (rural, older mapping) | ±2.8m | ±4.7m |
| 1:10,000 (mountain/moorland) | ±4.1m | ±7.1m |
What does this mean in practice? That building corner on your OS map could be nearly a metre from where it actually sits in an urban area – and potentially several metres out in rural areas mapped using older methods.
Relative Accuracy
This is arguably more important for site-specific work. It measures how accurately features are positioned relative to other nearby features within a local area.
For 1:1250 urban mapping, the relative accuracy specification is ±0.5m RMSE (±0.9m at 95% confidence) when measuring between well-defined points up to 60 metres apart. For 1:2500 resurveyed rural mapping, it is ±1.0m RMSE (±1.9m at 95% confidence) over distances of up to 100 metres.
In practice, the accuracy within a small site may be better than these specification tolerances – but crucially, without an independent survey, you have no way to verify this for your particular site. And even under the best-case urban scenario, that potential half-metre variance is not the precision you would want when positioning a new building just 3 metres from a boundary line.
OS vs Professional Survey: A Quick Comparison
To put this in perspective, here is how OS MasterMap compares with a bespoke topographical survey:
| Feature | OS MasterMap | Professional Topographical Survey |
| Positional accuracy | ±0.5m to ±4.1m RMSE depending on area | ±0.01m to ±0.02m (1-2 centimetres) |
| Data currency | Updated every six weeks nationally, but specific site data may be years old | Captured on the day of survey |
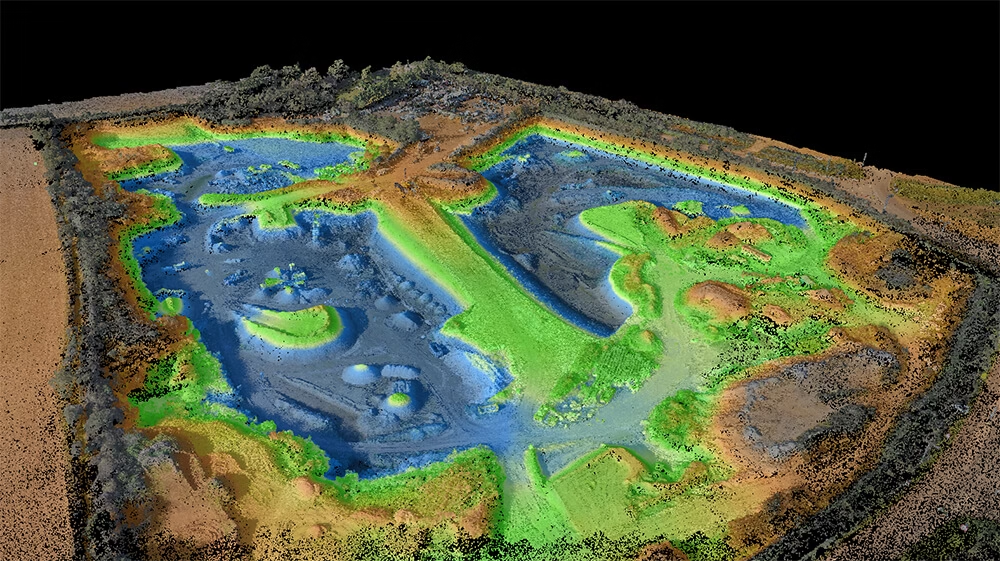
| Ground levels/contours | Not included in the Topography Layer (separate terrain products available at lower resolution) | Detailed 3D levels at regular intervals, typically every 5-10m |
| Tree information | Rough canopy outline only | Individual positions, species, trunk diameter, canopy spread |
| Building detail | Generalised footprints | Exact footprints, ridge heights, eaves levels |
| Utility covers | Not systematically recorded | Every cover located with type and cover level |
| Boundary features | Generalised positions | Walls, fences, hedges – with heights and construction details |
| Cost | Included in many public sector licences; commercial licences available | Bespoke fee based on site size and specification |
Based on our 22 years of experience, we always advise clients to commission a bespoke survey for any project requiring accurate geospatial data – whether for new builds, boundary-sensitive design, or engineering calculations. The one scenario where OS data alone might suffice is for early-stage feasibility assessments. But even then, we would recommend a topographical survey to ensure that all decisions and plans are based on accurate, up-to-date geospatial data. This removes any guesswork and allows you to progress your project with confidence.
The Hidden Impact of Map Scale
Here is something most people do not realise:
Physical lines on a map have width.
As HM Land Registry notes, the width of a line on a 1:1250 scale OS map roughly represents 0.3 metres on the ground, while on a 1:2500 map it represents approximately 0.6 metres. That single line thickness could be wider than a doorway.
This “generalisation” is necessary to keep maps readable. But it masks crucial detail that could make or break your project.
The Age Problem Nobody Talks About
Perhaps most critically, that OS map you are looking at is a snapshot frozen in time.
Whilst Ordnance Survey runs a continuous update programme – the Topography Layer is refreshed nationally every six weeks – the specific data for your site could be several years old. That new housing estate next door? The demolished warehouse? The repositioned kerb line from last year’s road improvements?
They might not be on your map at all.
We see this regularly in our work. Compared to when Terrain Surveys started in 2004, the pace and scale of development has increased significantly. We are now seeing OS data fall behind faster than ever, particularly in urban fringes and regeneration zones where developments happen at such a fast pace. It is not uncommon for us to arrive on site and find that demolished buildings, new access roads, or recently completed housing still appear – or fail to appear – on the current OS mapping. For architects and developers relying solely on that data for initial site appraisals, the consequences can be significant.
Common Reasons for Inaccuracies in OS Maps
Outdated Information: The Reality Gap
Here is the uncomfortable truth:
The map simply cannot keep pace with reality.
Think about how quickly the British landscape changes. New housing developments spring up seemingly overnight. Roads are widened. Buildings are demolished. Extensions are built.
Each change needs to be surveyed, processed, and integrated into the national database. That takes time. By the time it appears on your OS map, the next round of changes might already be underway. It is like trying to photograph a moving target – you are always slightly behind.
Generalisation: When Simplification Goes Too Far
OS maps are designed to be useful for millions of users across thousands of applications.
To achieve this, they must be readable. Clear. Uncluttered. But clarity comes at a cost.
Complex building outlines get simplified. Curved kerb lines become straight. Natural features lose their organic shapes. A building with multiple setbacks and projections might appear as a simple rectangle.
This works brilliantly for navigation or understanding the general layout of an area. It is utterly inadequate for detailed design work.
Historical Data: Digital Ghosts from the Past
Here is something that might surprise you:
Not all OS data was captured using modern survey equipment.
The accuracy figures vary significantly depending on when the mapping was originally surveyed. As the tables above show, older 1:2500 rural mapping that has not been through the Ordnance Survey’s Positional Accuracy Improvement (PAI) programme – completed in 2006 – can have absolute errors of nearly 5 metres at the 95% confidence level. This historical data has been digitised rather than resurveyed from scratch.
It is a bit like scanning an old photograph and calling it a new picture. The format is modern, but the underlying accuracy has not improved.
What many people do not realise is that you can often spot where the old and new mapping join. We regularly see a visible ‘step’ where features jump or become misaligned, especially on linear features such as roadways and boundaries. This occurs because the complete OS map cannot be updated in a single sweep. Instead, it is refreshed in various cycles, which may depend on development activity, strategic importance, and budget or resource constraints, among other considerations. Even when an area has been recently surveyed, it is quite common for some features still to remain unupdated – most often because aerial data was unusable due to cloud cover during flights, seasonal vegetation, or obstructed views.
Access and Obstructions: What the Surveyor Couldn’t See
OS surveyors are thorough, but they are not magicians.
They cannot access every piece of private land. They cannot see through tree canopies during aerial surveys. That row of parked lorries might obscure important ground features.
Vegetation is particularly problematic. Those mature trees on your site? The OS map might show a rough canopy outline from above, but it will not tell you the exact trunk positions, the spread at different heights, or how the roots might affect your foundations.
These are not failures of the OS system – they are inherent limitations of any national mapping programme. But they are limitations you cannot afford to ignore.
When Centimetres Make All the Difference
The Real Cost of Inaccuracy
Let’s put this in perspective with examples from our own project files.
We recently surveyed a site of approximately 30,000 square metres for a residential developer who had assumed the levels on the historic drawings were still valid and accurate. Our survey revealed that the site was in fact 150 millimetres lower across its entire extent. Had they proceeded without our data, the likely consequence would have been tens of thousands of pounds in additional earthwork and redesign costs. If the issue had been noticed later in the project, the costs could easily have spiralled into an eye-watering amount.
On another project, the proposed building had been designed with a setback of three metres from the site boundary. Our survey revealed the actual boundary was closer than the OS data showed, meaning the setback would have been only one metre – below the necessary requirement. By commissioning a full topographical survey before submitting planning, the client was able to adjust the designs with confidence. It is crucial that you have accurate and up-to-date geospatial data for any development project. This is the foundation of the project and must be correct. Relying on outdated, historic OS mapping or unverified surveys can have disastrous consequences.
These are not edge cases. In approximately 95% of our surveys, we find meaningful discrepancies between the OS data and measured reality – typically in the range of 0.1 to 5 metres for the positional accuracy of features across various settings.
An architect designing a building based on mapping with even a half-metre tolerance could face planning violations, on-site modifications costing thousands, delayed project timelines, and potential legal disputes.
A drainage engineer calculating falls and levels? Even small errors in levels can mean the difference between water flowing away from a building and water pooling against its foundations.
These are not acceptable risks for professional work.
The Professional Standard: Bespoke Topographical Surveys
This is where we come in.
Our Accuracy Standards
At Terrain Surveys, we do not work in metres. We work in centimetres.
Our topographical surveys are typically accurate to ±1 to 2 centimetres – that is at least twenty-five times more accurate than even the best-case OS urban RMSE figures. All surveys are conducted in accordance with the RICS Measured Surveys of Land, Buildings and Utilities standard and TSA guidelines.
This is not just a numbers game. This is the precision required for detailed design, engineering calculations, and construction setting out.
We routinely verify our own data against known control points. Our internal quality assurance shows that our measured points fall within ±15 millimetres of independently established coordinates, giving our clients confidence that the survey data is more precise than the best-case OS tolerance. We always verify our survey control by closing traverses where possible, undertaking closed-loop levelling on all survey control stations using an optical level, and carrying out independent GNSS observations. If the closure exceeds the project requirements, we re-observe the measurements until the appropriate accuracy is achieved. This is a step that separates a professional survey from the rest.
Real-Time Data
When we survey your site, we capture it as it exists that day. Not last year. Not five years ago. Today.
Every kerb edge, every manhole cover, every tree, every subtle change in ground level – captured precisely as your design team will encounter them.
The Details That Matter
We capture the critical information that OS maps omit by design:
- Precise ground levels and contours at regular intervals (typically every 5-10 metres, or closer where levels change rapidly)
- Individual tree positions, including species, trunk diameter, and accurate canopy spread
- Exact building footprints, not simplified outlines
- Ridge heights and eaves levels for neighbouring properties
- Every utility cover, with type and cover level
- Actual kerb lines, not generalised versions
- All boundary features – walls, fences, hedges – with heights and construction details
- Street furniture positions that could affect access or sightlines
This is not supplementary information. For professional work, it is essential.
How We Enhance OS Data (Not Replace It)
Here is something important:
We are not anti-OS. Far from it.
We often use OS data as a foundational layer for our surveys. It provides invaluable context about the surrounding area – the wider road network, neighbouring properties, the general landscape.
But we overlay this with our highly accurate, detailed survey of your specific site.
Think of it this way: OS provides the book. We provide the magnifying glass that lets you read the crucial fine print.
We can even provide you with the most up-to-date OS mapping as part of our service. But it is the bespoke survey data – those centimetre-accurate measurements – that will form the foundation of your successful project.

Who Needs This Level of Accuracy?
For Architects and Developers
You already know this, but let’s spell it out anyway.
You cannot – absolutely cannot – risk designing a project on generalised data.
Here is why centimetre accuracy is not just nice to have. It is essential:
Foundation Design – Your structural engineer needs precise ground levels to calculate foundation depths. A level error of even 30-40 centimetres could mean the difference between standard strip foundations and expensive piling solutions.
Cut and Fill Calculations – Earthworks are priced by volume. Inaccurate levels mean inaccurate volumes. Inaccurate volumes mean blown budgets. On sites we have surveyed, it is not uncommon to find discrepancies of several hundred cubic metres when comparing OS-derived assumptions with our measured data.
Flood Risk Analysis – The Environment Agency requires precise levels for flood risk assessments, and so do your insurers. Estimated levels are not sufficient when determining whether a site falls within or outside a flood zone. If you can only invest in one piece of survey data before committing to a site, an accurate topographical survey should be the priority. It will provide accurate mapping of the site as it exists and will include vital level information essential for flood risk analysis. A topographical survey is the starting point and foundation for your project – basing designs or plans on inaccurate or outdated information will derail your project before it has got off the ground.
Setting Out – When your contractor arrives on site, they need to position that building exactly where you designed it. Not “somewhere close”. Not “roughly there”. Exactly there. Get this wrong, and you are looking at costly on-site modifications – or worse, starting again.
Clients often tell us they did not expect how much detail is captured on site or how quickly we can deliver the results to such high standards. The feedback we hear most often from architects is how impressed they are with the customer service from start to finish – something we are really proud of.
For Engineers
Precision is not a luxury in engineering. It is the foundation of everything you do.
Drainage Systems – Designing effective drainage requires precise 3D data. You are working with falls as subtle as 1:100. Level errors mean your carefully calculated system simply will not function as designed.
Highway Design – New roads, junction improvements, visibility splays – they all require accurate topographical data. The highways authority will not accept anything less.
Utilities Infrastructure – Connecting to existing services requires knowing exactly where they are. Not roughly. Exactly. Our utility surveys locate every visible service point with centimetre precision.
For Property Owners
You might think professional surveys are just for big commercial projects.
You would be wrong.
Boundary Disputes – In England and Wales, HM Land Registry operates a “general boundaries” system, meaning the red line on your title plan only indicates the approximate position of the boundary – it does not define the exact legal boundary line. As the RICS guidance on boundary disputes explains, title plans are based on OS mapping and subject to its accuracy limitations. Courts and tribunals require detailed, professional survey evidence to determine precise boundary positions. If your neighbour claims a fence is in the wrong place, only a bespoke survey by a qualified surveyor can provide the definitive evidence needed to resolve the matter.
Planning Applications – Councils can and do reject planning applications based on inaccurate site plans, especially for extensions close to boundaries. Why risk it?
Party Wall Matters – Under the Party Wall etc. Act 1996, a Party Wall Award typically includes a schedule of condition recording the state of adjoining properties before work begins. Accurate survey data is essential for documenting existing conditions and protecting the interests of both building owner and adjoining owner. As the Government’s explanatory booklet notes, the award should contain a record of the condition of the adjoining property so that any damage can be properly attributed and made good. General mapping is not adequate for this purpose.
Garden Redesign – Even landscape projects benefit from accurate levels. Retaining walls, drainage, paving – they all rely on precise topographical information to work properly.
For Facilities Managers
Managing a large site without accurate base data?
That is like trying to navigate with your eyes closed.
Asset Management – You need to know exactly where your assets are. Every drainage gully. Every light column. Every underground service route. OS maps will not give you this detail.
Maintenance Planning – Coordinating maintenance across a complex site requires precise location data. Our surveys provide the definitive asset location plan you need.
Space Utilisation – Optimising your site layout requires understanding exactly what space you have. Not approximately. Exactly.
Compliance and Safety – Health and safety audits, accessibility compliance, emergency planning – they all require accurate site data. Can you afford to work with anything less?
The Bottom Line: When “Good Enough” Isn’t Good Enough
Ordnance Survey maps are a remarkable achievement.
They have mapped an entire nation. They provide invaluable context and orientation. For many purposes, they are absolutely perfect.
But let’s be clear:
When you are investing thousands (or millions) in a project, when you are dealing with legal boundaries, when precision directly impacts safety, cost, or compliance – OS maps alone are not designed for that purpose.
Not because they are badly made. But because they are built for a different job.
It is like using a kitchen knife for surgery. It is sharp, it is useful, but it is not the right tool for precision work. Whilst OS mapping is generally acceptable for early-stage feasibility assessments, it should never be used for detailed design work or engineering. OS mapping is intended for broad national reference, and positional errors of one to three metres are commonplace. Only a professional topographical survey will provide the accurate data your project demands.
Your Project Deserves Better
Every successful project starts with accurate information.
Not approximate. Not generalised. Not out-of-date. Accurate.
That is what a professional topographical survey provides. Current, comprehensive, centimetre-accurate data you can design with, build from, and rely on completely.
Think of it as insurance – insurance against costly mistakes, against delays, against disputes, against the nightmare of discovering, halfway through construction, that your base data was wrong.
Compared to the total cost of your project, a professional survey is a tiny investment. Compared to the cost of getting it wrong, it is priceless.
Ready to Build on Solid Ground?
Don’t leave your project to chance.
If you need data you can build on – literally and figuratively – you need a survey you can trust.
Since 2004, our team at Terrain Surveys has completed over 10,000 topographical surveys across Britain. In the last 12 months alone, we delivered approximately 1,000 surveys ranging from a small garden survey of a domestic property to an inner-city housing estate, and everything in between. We are proud members of The Survey Association (TSA), an Approved Development Partner at the Chartered Institution of Civil Engineering Surveyors (CICES), ISO 9001:2015 accredited, and hold Constructionline Gold membership. From single plots to entire development sites, from highways schemes to hospital campuses, we provide the precise, reliable data professionals depend on.
We will advise you on exactly what survey specification your project requires. No overselling. No unnecessary extras. Just the right level of detail for your specific needs.
Get your free, no-obligation quote today.
Because whilst OS maps might be good enough for finding that country pub, they are not good enough for your professional project.
And you deserve better than “good enough”.